MIST
Magnetosphere, Ionosphere and Solar-Terrestrial
Regression to the mean can explain saturation of geomagnetic storms
Regression to the mean can explain saturation of geomagnetic storms
By Maria-Theresia Walach (Lancaster University)
submitted on behalf of Nithin Sivadas (Goddard Space Flight Center/Catholic University of America)
The strength of the solar wind that ‘drives’ (transfers energy to) the magnetosphere is different from the measurements made by satellites at L1, upstream of the magnetosphere. This difference is due to random errors resulting from substantial uncertainty in the timing, evolution and structure of the solar wind. We questioned the premise on which the saturation theories were constructed, and wondered whether there is reliable evidence that the saturation effect is real. We therefore set out to understand and calculate how uncertainty in the input of a system (in this case, the solar wind) affects inferences from data about the response of the system (Earth).
Using data from the Wind, THEMIS, MMS, DoubleStar and Cluster spacecraft, we found that random errors in the reported strength of the solar wind that strikes Earth depend on the strength of the solar wind, which has a log normal probability distribution. We used a Monte Carlo error model to calculate the probable ‘true’ value behind each measurement of solar-wind strength. Unexpectedly, we found a saturation of these true values as the measurement values increased, which is similar to the effect observed in the data (Fig. 1a). In other words, the true value regresses to the mean and away from the measurement, owing to the nature of the random error and statistical properties of the solar-wind strength. Correcting for uncertainties in timing and magnitude reveals that the Earth’s response in the polar PCI index to solar wind driving is linear throughout, which means driving of the magnetospheric system can be twice as large as previously thought for extreme geomagnetic storms (Fig. 1b).
References:
Main paper: Sivadas, N., Sibeck, D., Subramanyan, V., Walach, M.-T., Ozturk, D. S., Ferdousi, B., Michotte de Welle, B., Regression to the mean can explain saturation of geomagnetic storms. Nature 655, 1143–1147 (2026). https://doi.org/10.1038/s41586-026-10757-4. https://rdcu.be/fwSqV
For the interested reader, we recommend the Extended Data and Figures sections and the Supplementary Information section, which hold a large proportion of content for this paper. For a quick synopsis, we recommend the editorial summary below.
Research briefing: https://doi.org/10.1038/d41586-026-02245-6
See publication for more details:
Sivadas, N., Sibeck, D., Subramanyan, V., Walach, M.-T., Ozturk, D. S., Ferdousi, B., Michotte de Welle, B., Regression to the mean can explain saturation of geomagnetic storms. Nature 655, 1143–1147 (2026). https://doi.org/10.1038/s41586-026-10757-4. https://rdcu.be/fwSqV and Research Briefing, https://doi.org/10.1038/d41586-026-02245-6
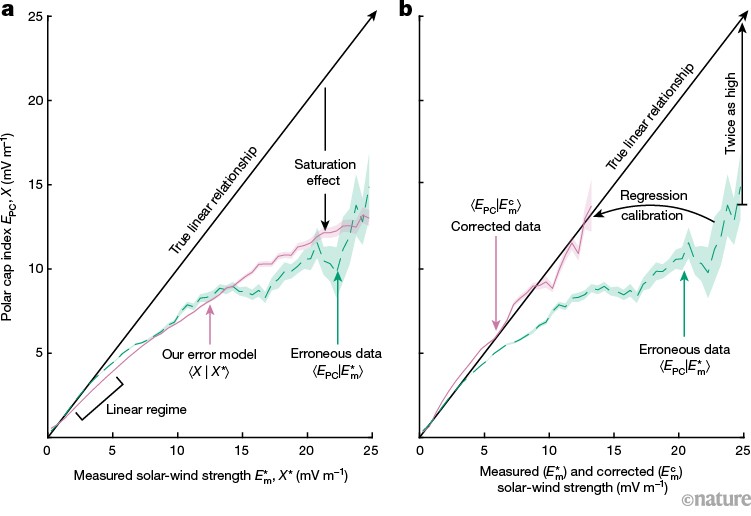
Uncertainty in measurements of solar wind explains the observed saturation of geomagnetic activity. a, Observations from 1995 to 2019 (green) indicate that, on average, the polar cap index (EPC, a measure of Earth’s geomagnetic response to solar wind) saturates at measurements of large solar-wind strength (E*m). The result of our statistical approach, the Monte Carlo error model (pink), predicts the same saturation effect arising from uncertainty in the measurement of solar wind transferring energy to Earth’s magnetosphere, rather than a physical mechanism. X* and X are measured and ‘true’ solar-wind strengths from the error model. b, Correcting the effect of random errors in values of solar-wind strength shows that Earth’s geomagnetic response is linear (pink), where Ecm is the corrected solar-wind strength. Credit: Sivadas, N. et al./Nature (CC BY 4.0) (https://doi.org/10.1038/d41586-026-02245-6)
Temporal Variability of Saturn's H2 Dayglow and Northern Aurora Observed by Hisaki and Cassini
Temporal Variability of Saturn's H2 Dayglow and Northern Aurora Observed by Hisaki and Cassini
By Leah Clare (Lancaster University)
The ultraviolet (UV) emissions from Saturn are composed of the dayglow from the sunlit atmosphere and the aurorae at the poles. Investigation into the daily variability of the dayglow remains somewhat unconstrained, particularly on timescales of weeks. Utilising coincident Hisaki and Cassini observations across ~3 weeks in 2014, we determine the temporal variability of the UV emitted power, assess the response of the dayglow to solar activity, and constrain the contribution from the northern aurora to the total emitted power. We find that the power varies by a factor of 2.26 over 23 days with Hisaki, and 1.29 over 17 days with Cassini. Upon separation of the northern auroral contribution with Cassini, the contribution is found to be between 10% - 26%. Additionally, the dayglow component displays a strong correlation with solar activity, confirming that the dayglow is controlled by the UV solar flux as shown by previous studies (Gustin et al., 2010; Liu & Dalgarno 1996). This study demonstrates the first analysis of the Saturn campaigns by Hisaki, allowing an assessment of the robustness of such a mission in observing outer planet targets. The multi-mission analysis confirmed that Hisaki was able to track the variability of the UV emissions from Saturn, with comparative trends to the Cassini data.
References:
Gustin, J., Stewart, I., Gérard, J. C., & Esposito, L. (2010). Characteristics of Saturn’s FUV airglow from limb-viewing spectra obtained with Cassini-UVIS. Icarus, 210(1), 270–283. https://doi.org/10.1016/j.icarus.2010.06.031
Liu, W., & Dalgarno, A. (1996). The Ultraviolet Spectrum of the Jovian Dayglow. The Astrophysical Journal, (462), 502–518.
See publication for more details:
https://doi.org/10.1029/2026JA035194
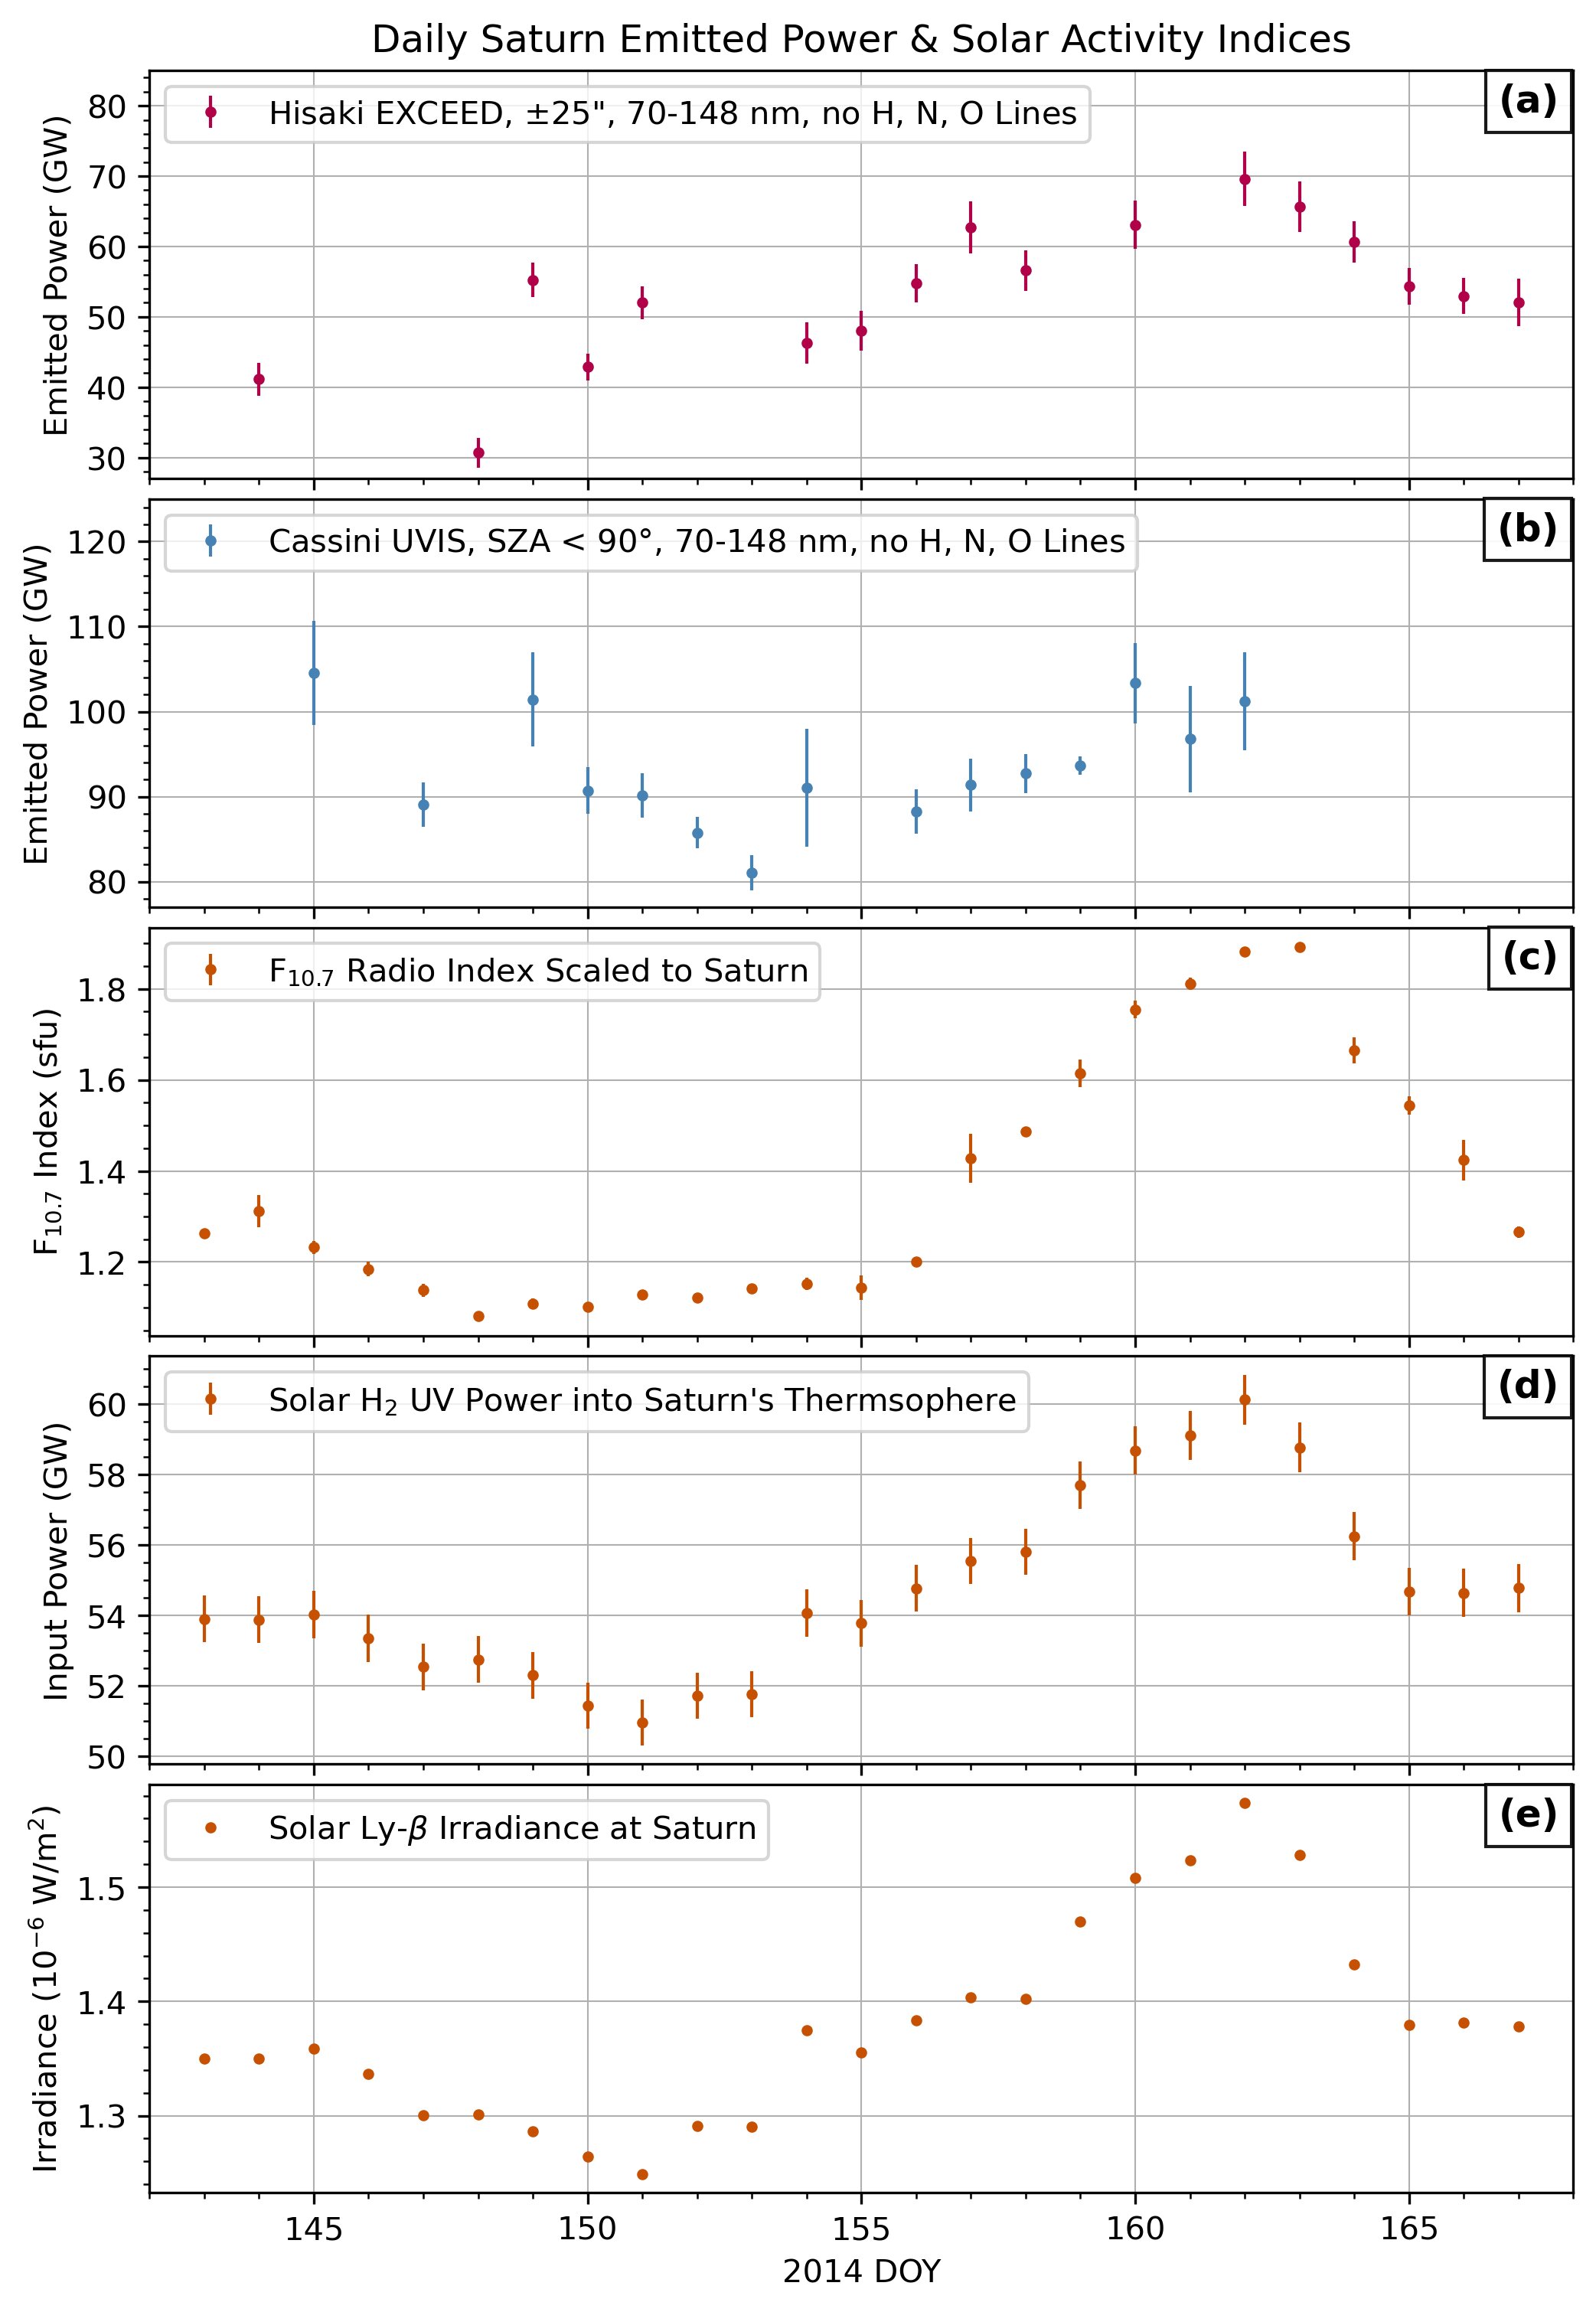
(a) The total emitted UV power obtained from Hisaki/EXCEED. The points are daily average H2 powers from 70 to 148 nm. (b) The total emitted UV power determined with Cassini UVIS; each point is the daily average H2 power for the wavelength range 70–148 nm. (c) The daily average solar F10.7 radio index, a proxy for EUV radiation, scaled to Saturn. Data from Space Weather Canada. (d) The solar EUV power into Saturn's thermosphere. Solar spectral irradiance data are obtained from LISIRD, which uses the Flare Solar Irradiance Model (Chamberlin et al., 2008) and Earth irradiance measurements. The calculation is from Gershman and DiBraccio (2024). (e) The solar H‐Lyman β irradiance at Saturn; data are obtained from LISIRD, which uses the Flare Solar Irradiance Model (Chamberlin et al., 2008) and Earth irradiance measurements.
Solar Activity References:
Chamberlin, P. C., Woods, T. N., & Eparvier, F. G. (2008). Flare irradiance spectral model (fism): Flare component algorithms and results. Space Weather, 6(5). https://doi.org/10.1029/2007SW000372
Gershman, D. J., & DiBraccio, G. A. (2024). Quantifying External Energy Inputs for Giant Planet Magnetospheres. Geophysical Research Letters, 51(15). https://doi.org/10.1029/2024GL109660
The Jupiter Auroral Ionosphere Code
The Jupiter Auroral Ionosphere Code
By Jonathan Nichols (University of Leicester)
We present a new model of auroral precipitation and associated phenomena at Jupiter, called the Jupiter Auroral Ionosphere Code (JAIC). The hybrid model follows the primary electron population using a Monte Carlo code that runs on a GPU, and computes the contribution of the secondaries using a two‐stream approximation. The model includes modules that compute high resolution far‐ultraviolet H2 spectra, the H3+ density using simple ion chemistry, and the resulting Pedersen conductivity and H3+ radiance. We illustrate the validity of the model and present a number of initial applications. We show that the model successfully relates Juno auroral electron and UV observations, and that an auroral polar transient form is consistent with excitation by ∼ 23± 4 keV electrons. We also compute a self‐consistent relation between field‐aligned current density and Pedersen conductance and show that it is consistent with Juno in situ observations. We suggest that Joule heating enabled by the electron contribution to the Pedersen conductivity may explain heating observed at mbar levels. We further show that, in contrast with initial analysis, polar H3+ emissions observed by the James Webb Space Telescope are consistent with the electron population above the auroral zone.
The model is publicly available at GitHub and Zenodo: https://github.com/jdnplanets/jaic
See publication for more details:
Nichols, J. D. (2026). Jupiter's auroral ionosphere: Hybrid Monte Carlo, auroral spectrum and conductivity modeling. Journal of Geophysical Research: Space Physics, 131, e2026JA035228. https://doi.org/10.1029/2026JA035228
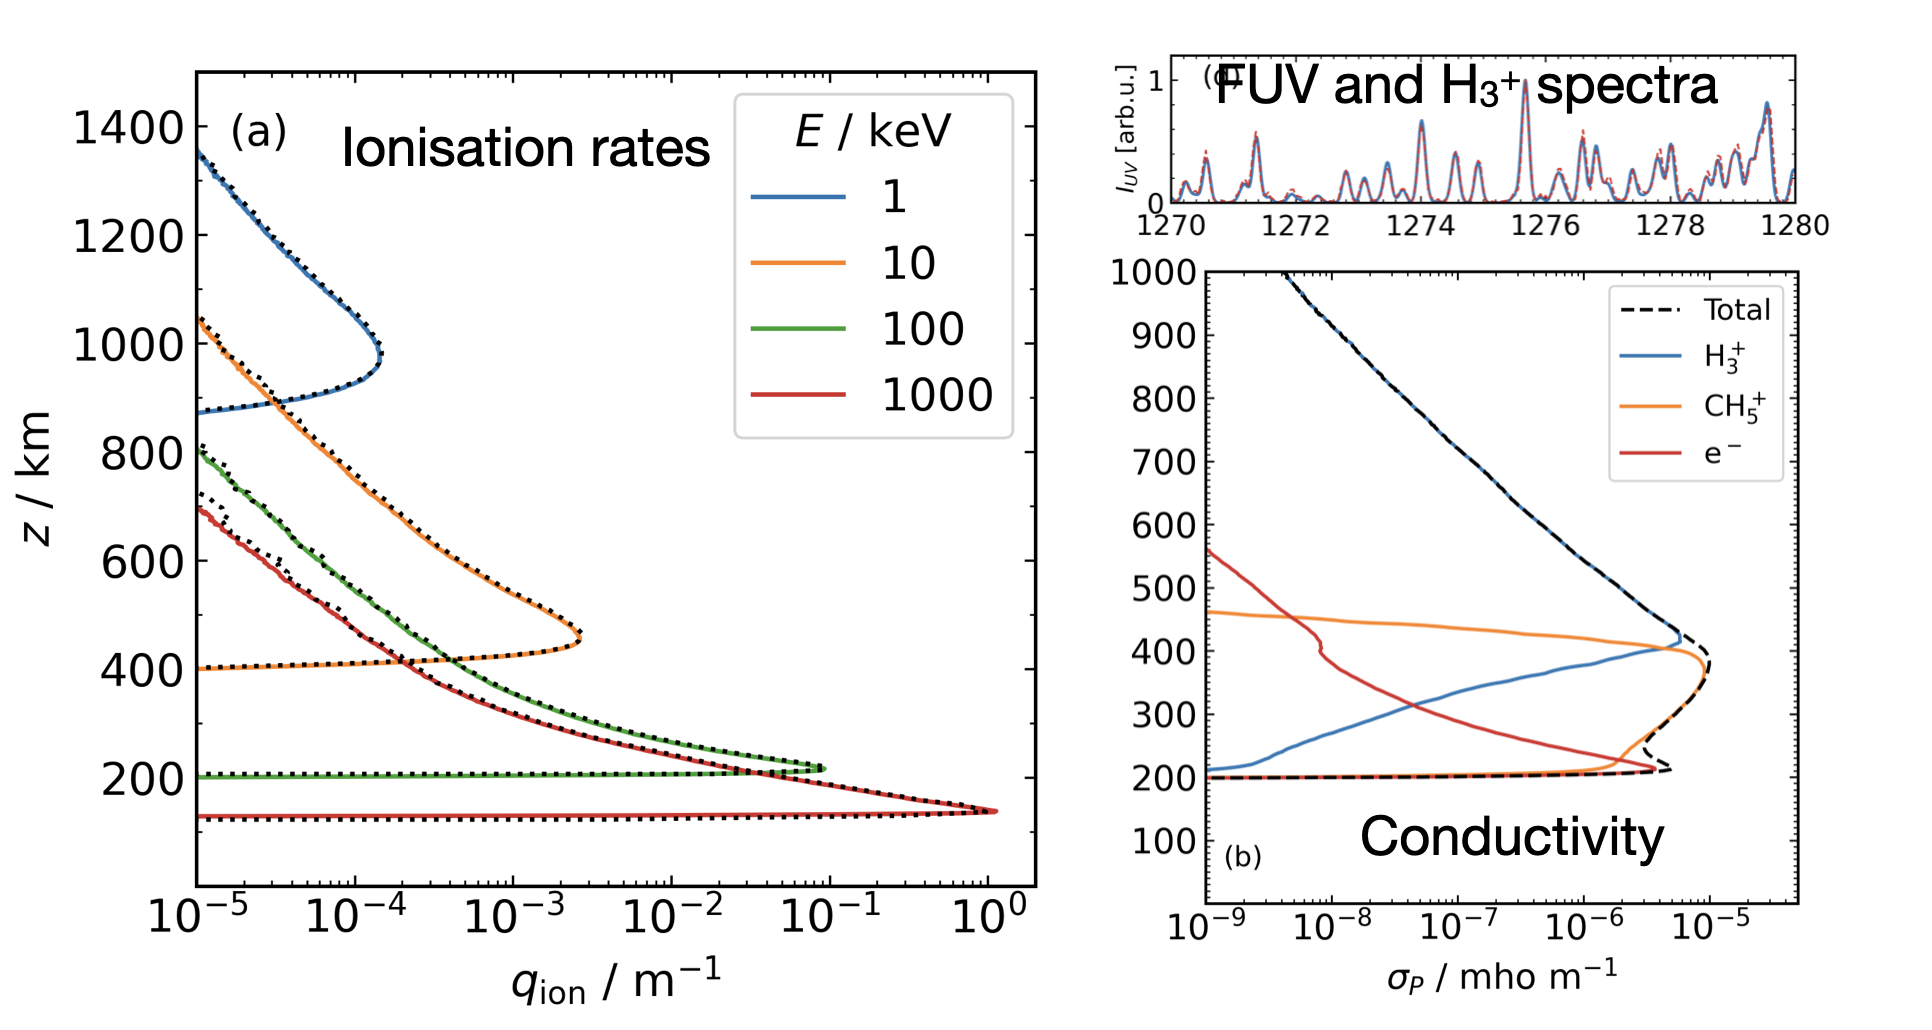
A selection of outputs from JAIC: ionisation rates, Pedersen conductivity and FUV spectra. For further details see Nichols (2026).