MIST
Magnetosphere, Ionosphere and Solar-Terrestrial
Short-Term Variability of Jupiter's Satellite Footprints as Spotted by JWST
Short-Term Variability of Jupiter's Satellite Footprints as Spotted by JWST
By Katie Knowles (Northumbria University)
The James Webb Space Telescope (JWST) conducted a clockwise scan around the entire limb of Jupiter, chasing the northern lights, or aurora, as they rotated into view. This dynamic phenomenon is a result of charged particles traveling down magnetic field lines, crashing into the top of the atmosphere, or ionosphere, and causing it to glow. During its scan, JWST captured an extraordinary aspect of Jupiter's aurora, known as the auroral footprints, which are bright emission patterns produced as a result of the interaction between Jupiter's Galilean moons and the space environment surrounding the planet. Here, we present the first measurements of the physical properties of the auroral footprints of Jupiter's two innermost Galilean moons, Io and Europa, including the local temperature and ionospheric density, in the near-infrared. A never-seen-before low temperature structure was discovered, centred on Io's bright spot of emission, possessing extremely high densities. This is likely driven by extreme changes in the flow of electrons crashing into the upper atmosphere. Our analysis, as well as further endeavours, can supply context to in-situ measurements acquired by NASA's Juno spacecraft as it traversed within the moons' orbits, as well as for future investigations of the Galilean satellites, including the Jupiter Icy Moons Explorer (Juice) and Europa Clipper.
See publication for more details:
Knowles, K. L., Melin, H., Stallard, T. S., Moore, L., O’Donoghue, J., Schmidt, C., et al. (2026). Short-term variability of Jupiter's satellite footprints as spotted by JWST. Geophysical Research Letters, 53, e2025GL118553. https://doi.org/10.1029/2025GL118553
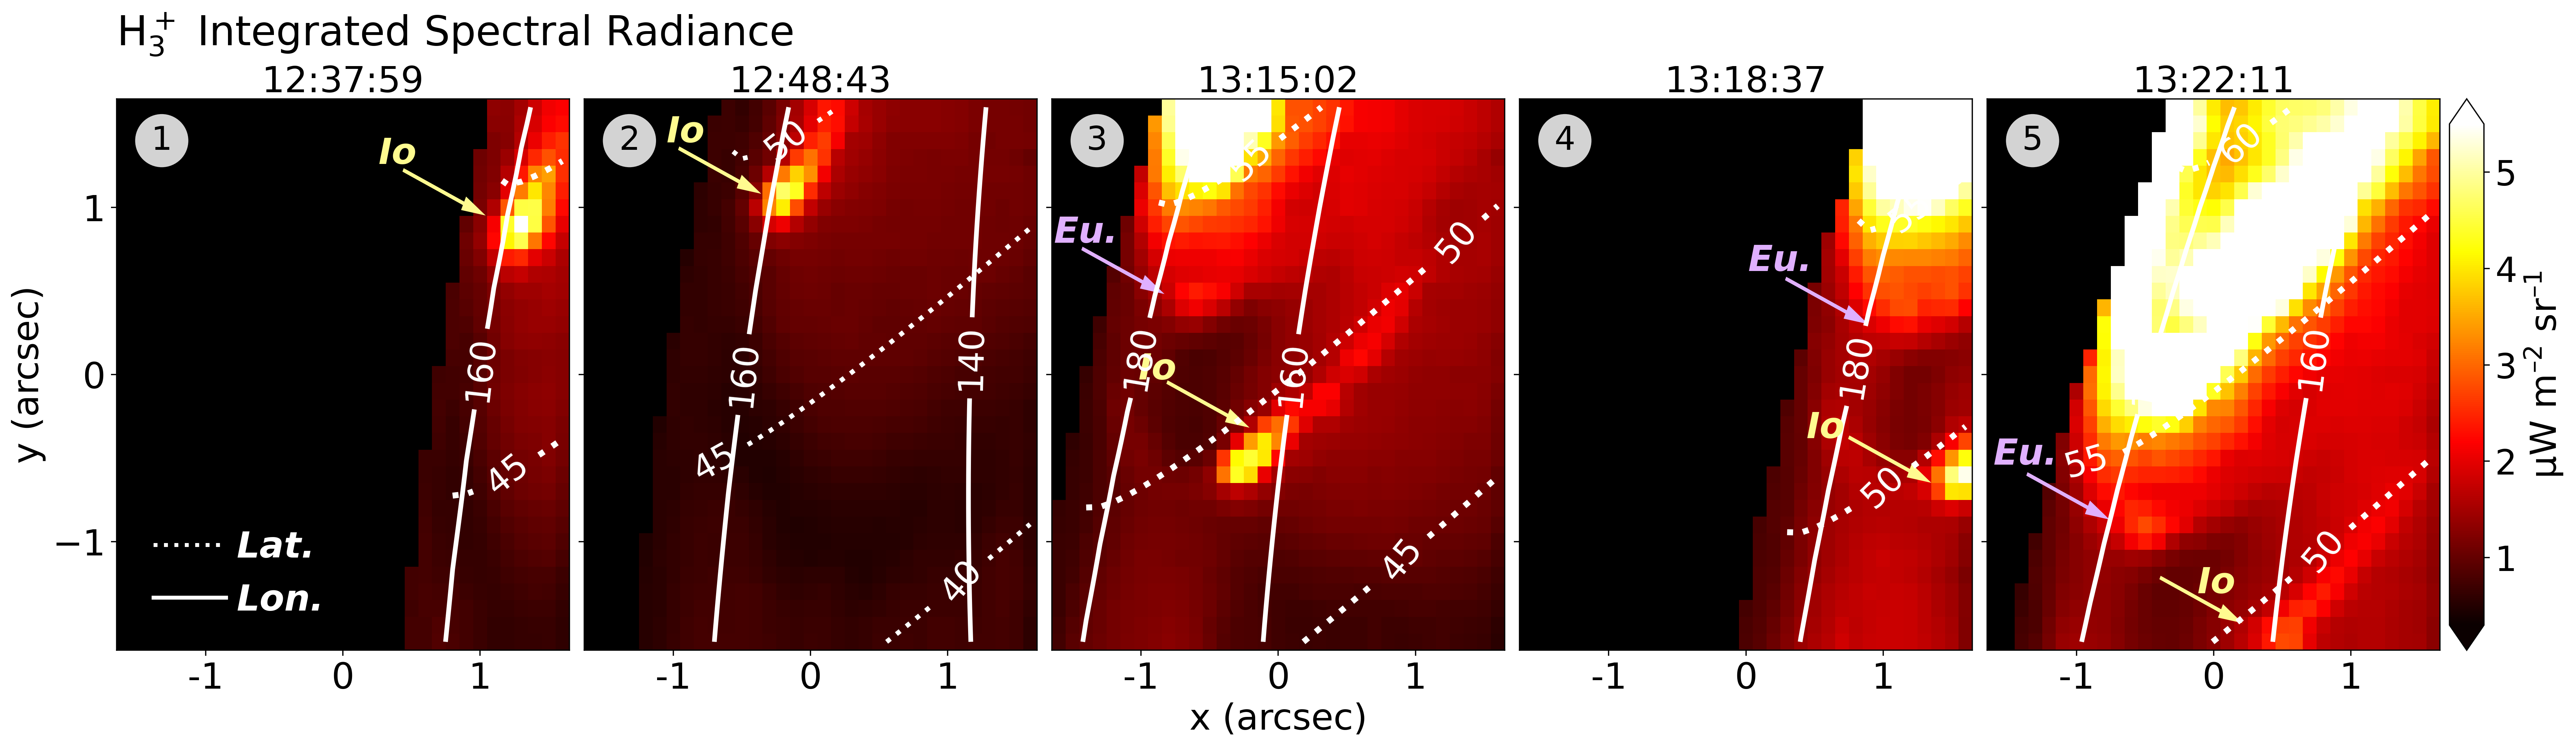
JWST/NIRSpec IFU observations of the auroral footprints of Io and Europa, indicated by yellow and purple arrows, respectively. We display the integrated H3+ spectral radiance with planetocentric latitude at 550 km above the 1-bar level (dotted) and System III (West) longitude (solid). UTC mid-points of integration are given above, and the circled numbers refer to the exposure label.
Diffusion Coefficients for Resonant Relativistic Wave-Particle Interactions Using the PIRAN Code
Diffusion Coefficients for Resonant Relativistic Wave-Particle Interactions Using the PIRAN Code
By Oliver Allanson (University of Birmingham; University of Exeter)
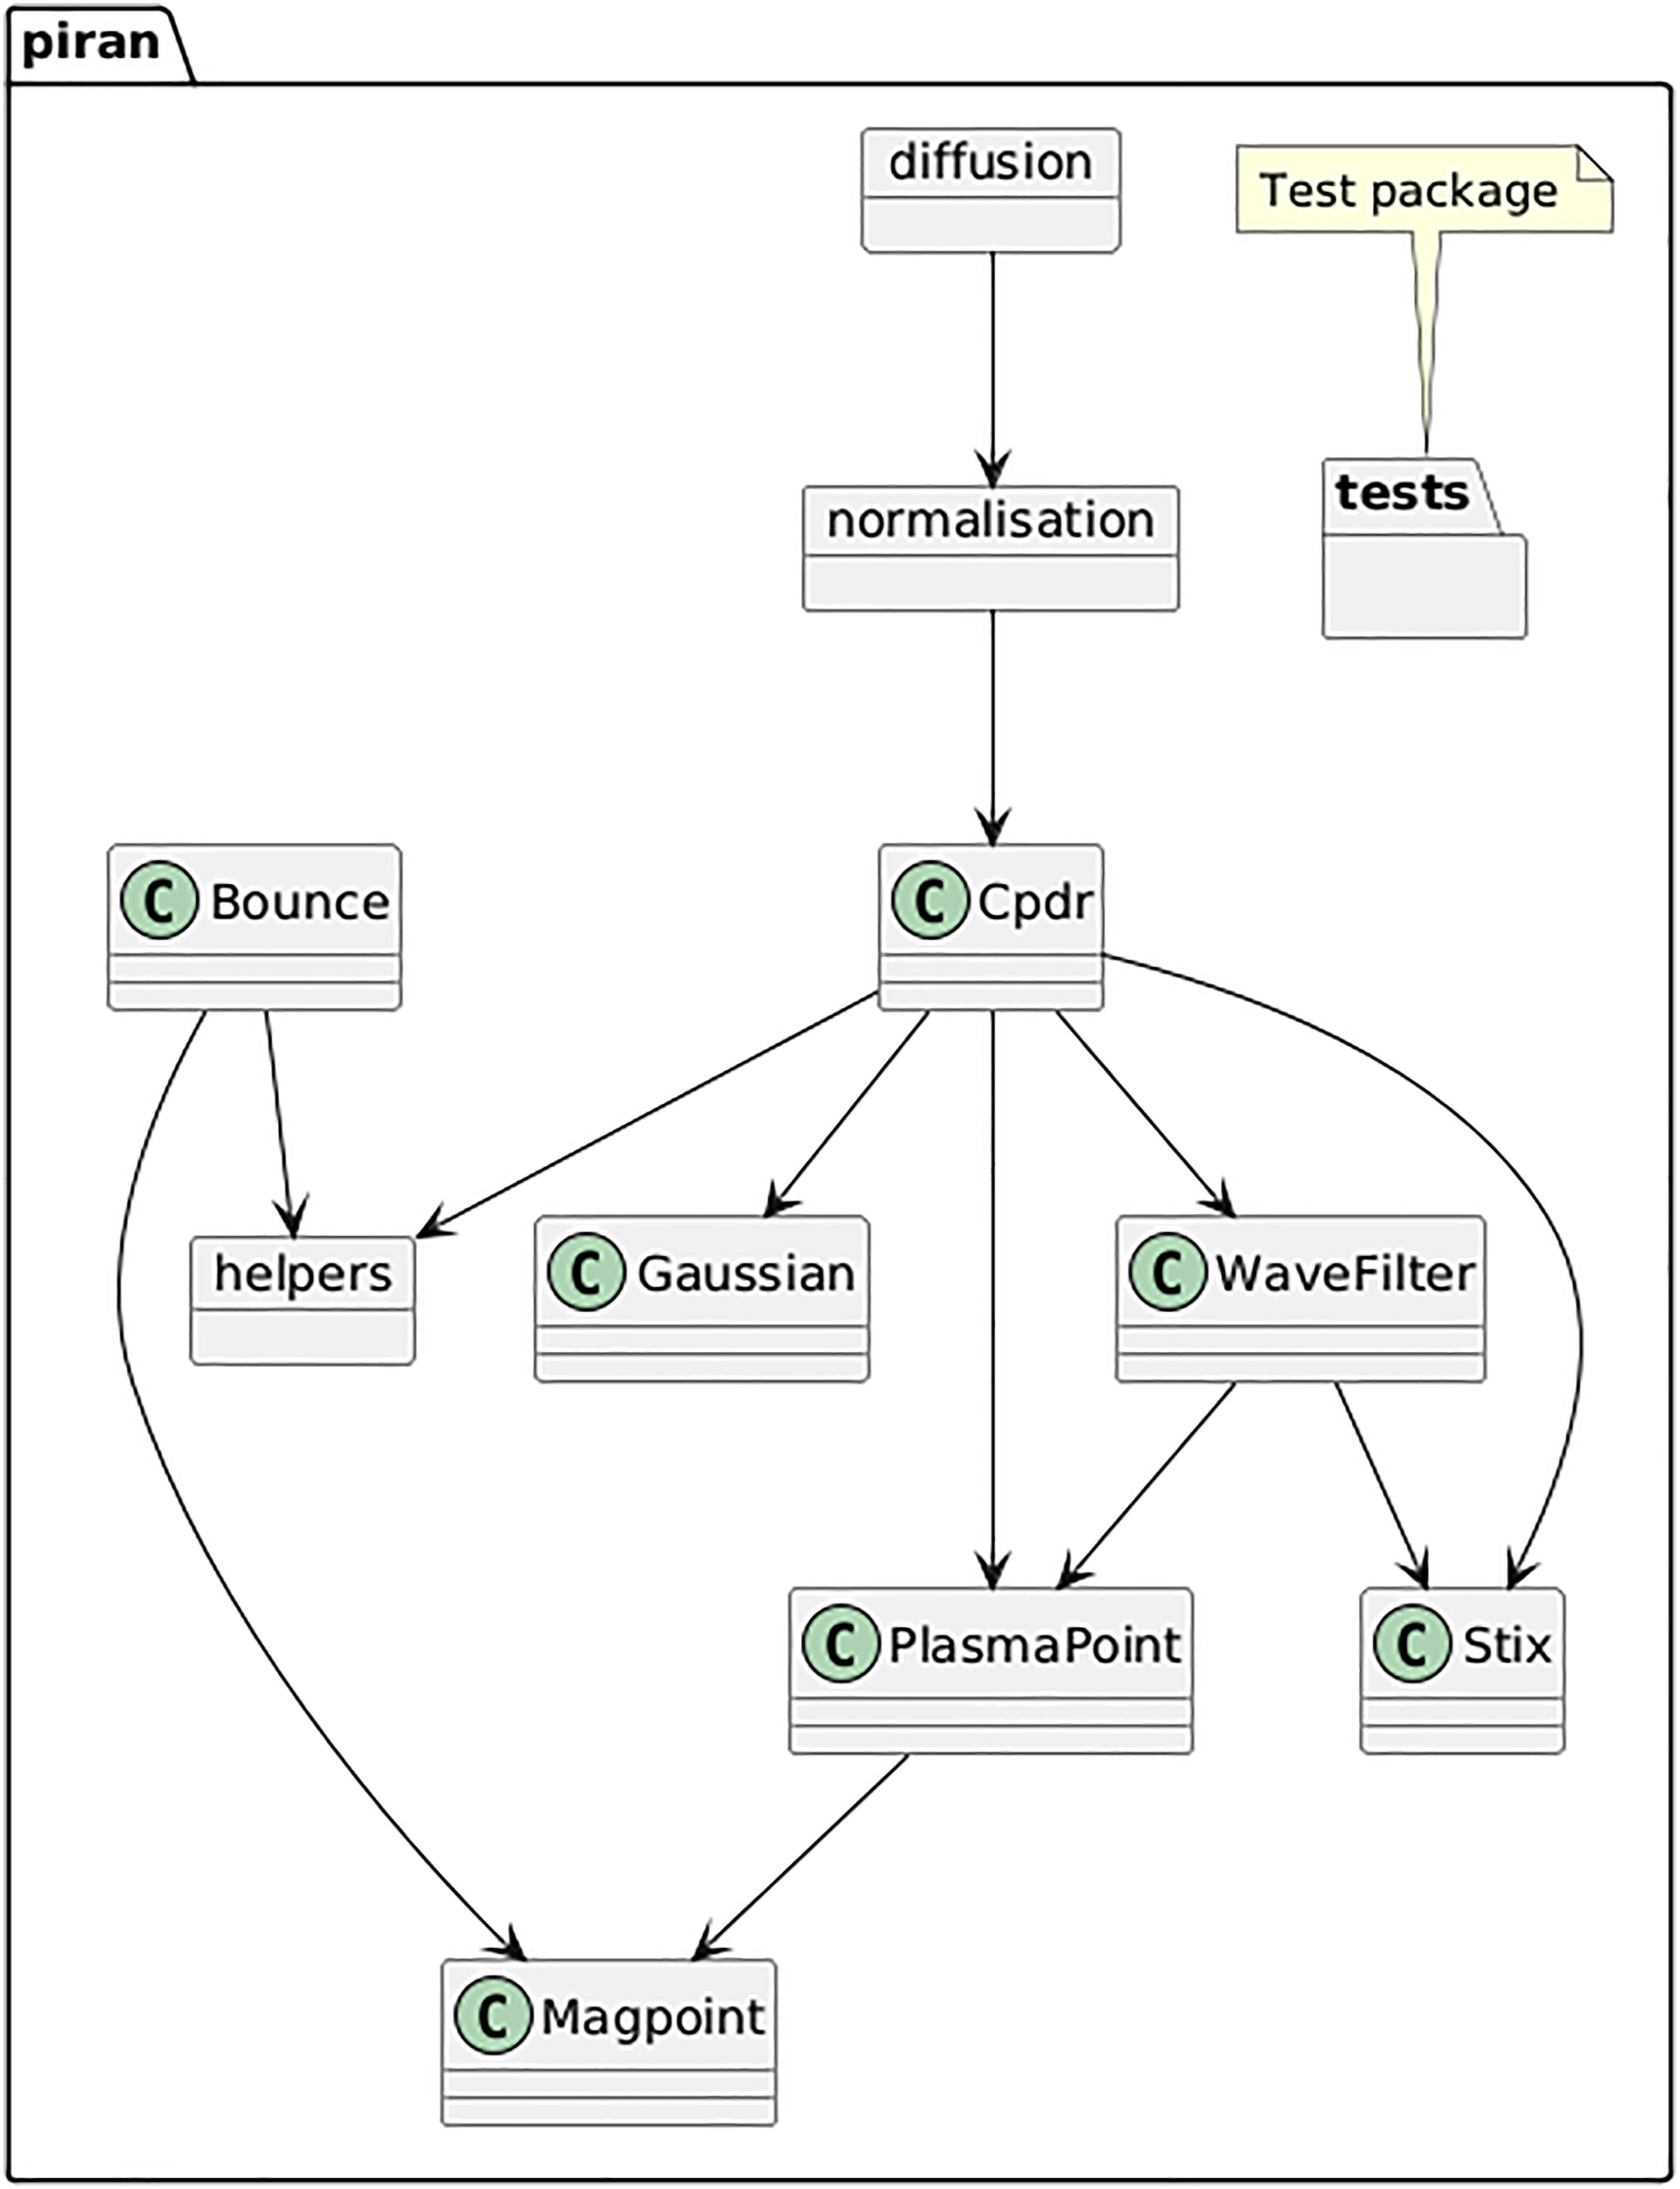
Quasilinear diffusion coefficients can be used to model the response of charged particles to resonant wave-particle interactions. The calculation of these coefficients is sufficiently complicated and arduous to render it prohibitive to many potential users, because of the expense in time spent developing the code. The PIRAN software package (”Particles In ResonANce”) is written using Python, and allows the user to calculate local and bounce-averaged relativistic diffusion coefficients in energy and pitch-angle space via the two main current proposed methods in the literature. The code is predominantly based upon the formalisms and methods presented in Glauert and Horne (2005, https://doi.org/10.1029/2004JA010851) and Cunningham (2023, https://doi.org/10.1029/10.1029/2023JA031703). We solve for diffusion coefficients using exact relativistic formulae. We use Gaussian spectra in wave frequency and in tangent of the wave normal angle and solve the full cold-plasma dispersion relation. At present the code supports fully tested calculations for electron diffusion coefficients based on whistler-mode waves in a fully ionized proton-electron cold plasma. However the codebase architecture is built such that future developments to include other wave modes and other plasma compositions should involve incremental additions. The initial release of PIRAN may not have the same number of features as some other numerical codes, but is has the advantages of being a fully open-source diffusion coefficient code that: (a) supports calculation of both local and bounce-averaged diffusion coefficients via both of the two proposed methods; (b) is written fully in Python; (c) has detailed user pages, commit history and changelog on GitHub.
The codebase is made available with the “GNU General Public License version 3” (https://opensource.org/license/gpl-3-0). All users of the code should follow the instructions of that license, and cite this paper in any publications or reports that make use of the PIRAN software package and repository. The work in this paper particularly refers to PIRAN Release 1.1.0 (Kappas et al., 2026).
O.A. and his wife Sophie, and their family, would like to gratefully acknowledge the outstanding support and contributions of the Williams Syndrome Foundation (WSF) in the United Kingdom (https://williams-syndrome.org.uk/). The WSF is a registered charity that promotes research and funding, and provides help and support for families and individuals with the rare congenital disorder known in the UK as Williams Syndrome (sometimes also known as Williams-Beuren syndrome). As such this software package is eponymously named after the son of Oliver and Sophie (who doesn't much care for diffusion coefficients himself). This acknowledgement serves to thank the WSF for their support to the lead author and his family during the preparation of work in this manuscript.
Paper: https://doi.org/10.1029/2025EA004479
Code: https://github.com/RB-ENVIRONMENT/PIRAN
Documentation: https://rb-environment.github.io/PIRAN/
Release 1.1.0: https://zenodo.org/records/18875558
Please email This email address is being protected from spambots. You need JavaScript enabled to view it. with any questions.
The Non-Linear Dependence of Daily Maximum Ionospheric Total Electron Content on F10.7
The Non-Linear Dependence of Daily Maximum Ionospheric Total Electron Content on F10.7
By Martin Cafolla (University of Warwick)
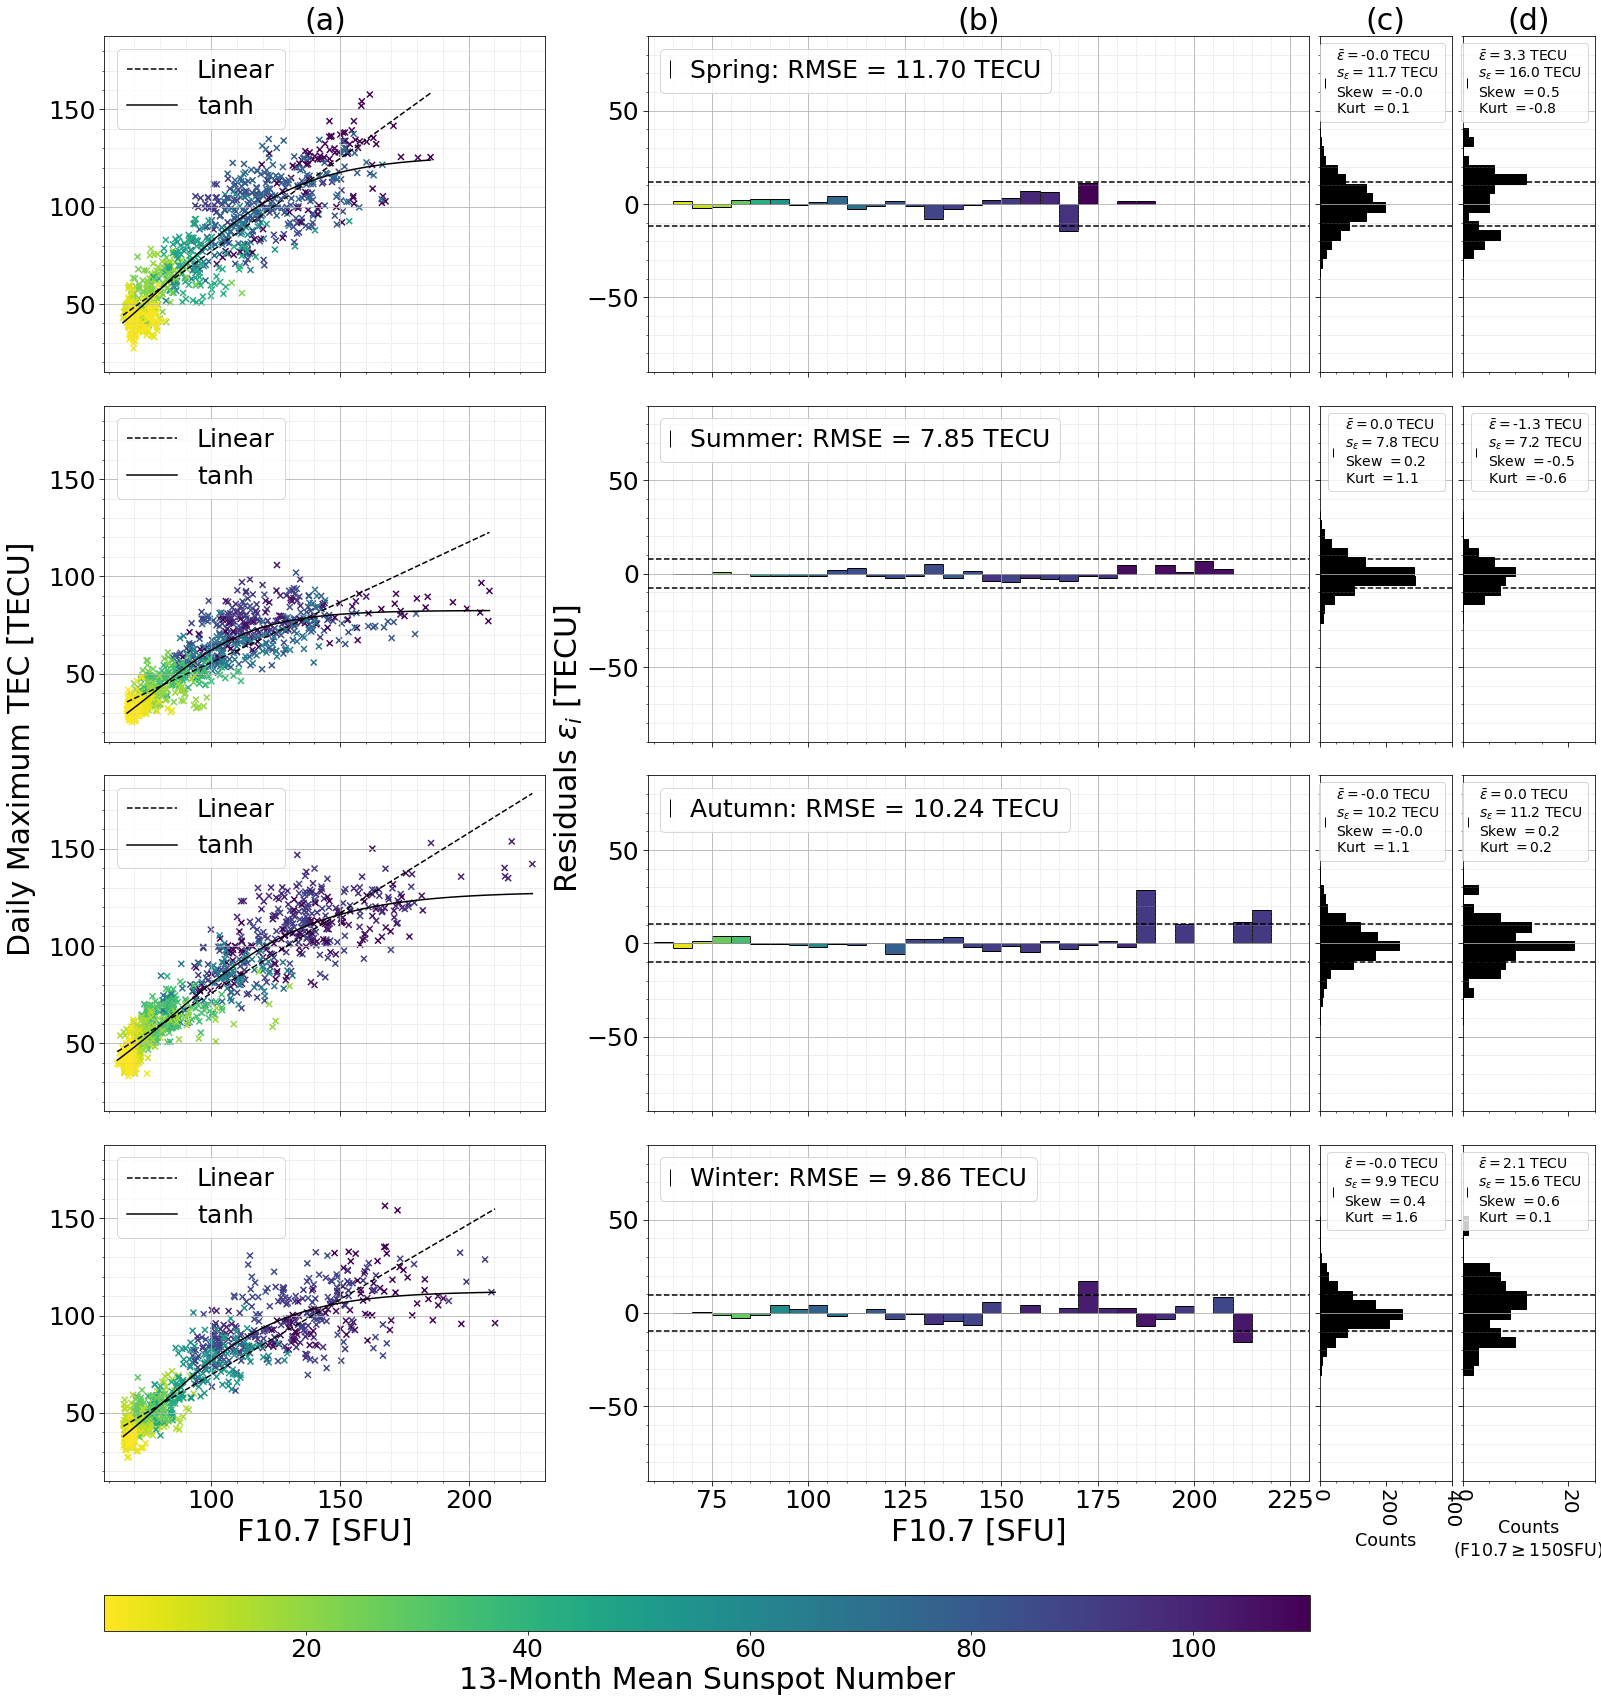
Solar Extreme Ultraviolet (EUV) radiation drives ionisation in the upper atmosphere to create the ionosphere. The variability of the intensity of this radiation results in regions of high electron number density across the ionosphere, characterised by the Total Electron Content (TEC). The daily solar flux at 10.7cm, the F10.7 index, is commonly used as a proxy to EUV in ionospheric models. Typically studies have shown how either the global averages or geographically local values of TEC vary with daily F10.7, F10.7A (the 81-day average) and F10.7p (a combination of daily F10.7 and F10.7A). We study how the daily maximum TEC correlates with daily F10.7 using 15-minute Global Ionospheric Maps (GIMs) from the Jet Propulsion Laboratory (JPL) between 2003-2024.
We find that for F10.7 ≳ 78 − 85 SFU, the daily maximum TEC saturates to a seasonally dependent value between 83−128 TECU. We asses the distribution of the residuals from linear and non-linear least squares fitting as a function of F10.7, as demonstrated in the figure below, and find that a tanh function out-performs a linear function for F10.7 ≥ 150 SFU. Our results are sensitive to different hemispheres, as a result of the construction of JPL-GIMs. Finally, we find that the daily F10.7 clearly resolves the saturation of daily maximum TEC, while F10.7 based on the average does not. Quantifying the value at which the daily maximum TEC saturates with F10.7, and its seasonal dependence, specifies the requirements of systems that are sensitive to extremes in TEC, important in planning of Low Earth Orbit satellite operations.
See publication for more details:
Cafolla, M. A., Chapman, S. C., Watkins, N. W., & Verkhoglyadova, O. P. (2026). The non-linear dependence of daily maximum ionospheric total electron content on F10.7. Space Weather, 24, e2025SW004745. https://doi.org/10.1029/2025SW004745